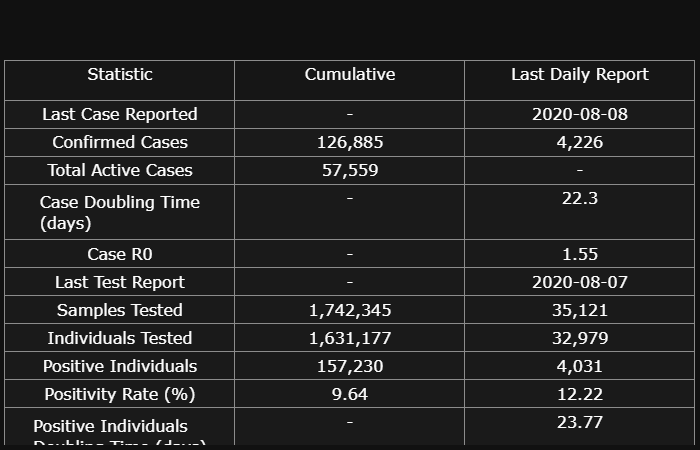
The Summary Table
A summary table is added at the tracker home page. It includes the cumulative and last daily report statistics along with other computations done in the tracker project like doubling time and R0. I’m still undecided if I’ll add this too on other pages or not.

Improved Viewing Experience for Mobile
The chart sizes have been adjusted for better viewing in mobile screens. The charts, when viewed in mobile screens initially didn’t have a responsive design. Some of the changes made were the following
- Removed automargin in the figure layouts then manually adjusted the margins.
- Shifted to include tags instead of iframe.
- Added max height for small screens.
Distributed the Charts to Separate Pages
Related charts were moved together to their own ‘sub-pages’ for faster loading time for each page. This is because the charts use a lot of resources during loading and the ideal loading time should be around 3 seconds.