Last 30 Days
Links
Confirmed Cases
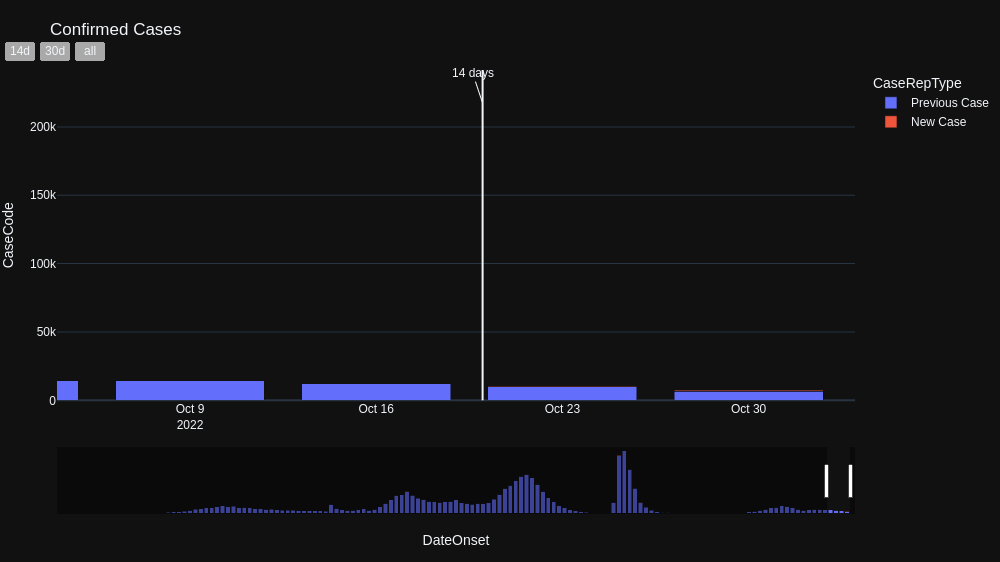
Daily confirmed cases with highlighted newly reported cases are shown in the chart below.
Data within the last 15 days is not yet complete due to reporting delays.
Click here to see more on confirmed case statistics.
Active Cases
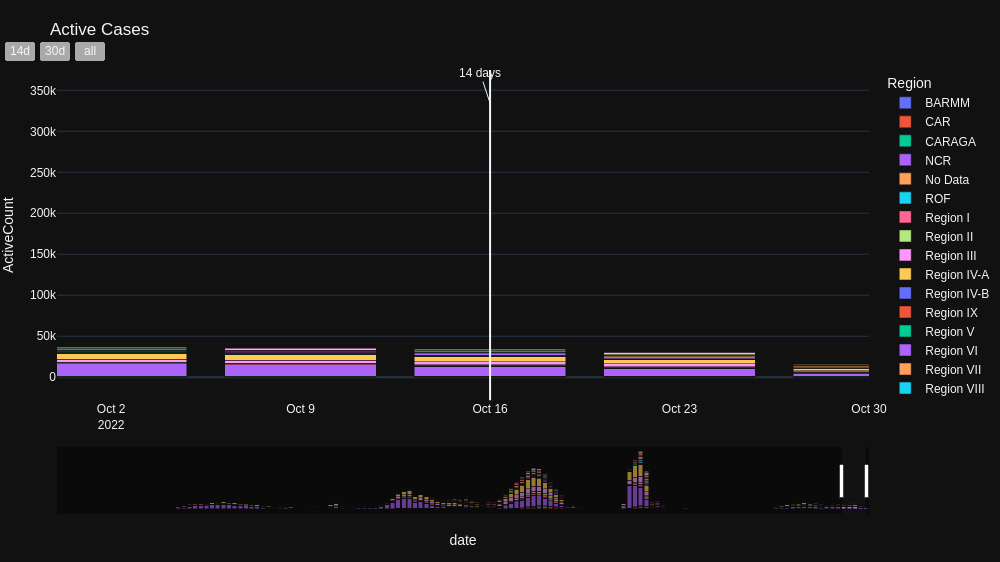
Daily active cases by region are shown in the chart below. Date of onset of
illness and date of recovery are used instead of the date of reporting of
confirmed case and date of reporting of recovery. Refer to the Confirmed Cases
and Recoveries sections to see the date proxies applied.
Data within the last 15 days is not yet complete due to reporting delays and
the weekly recovery tagging by DOH.
Click here to see more on active case statistics.
Recoveries
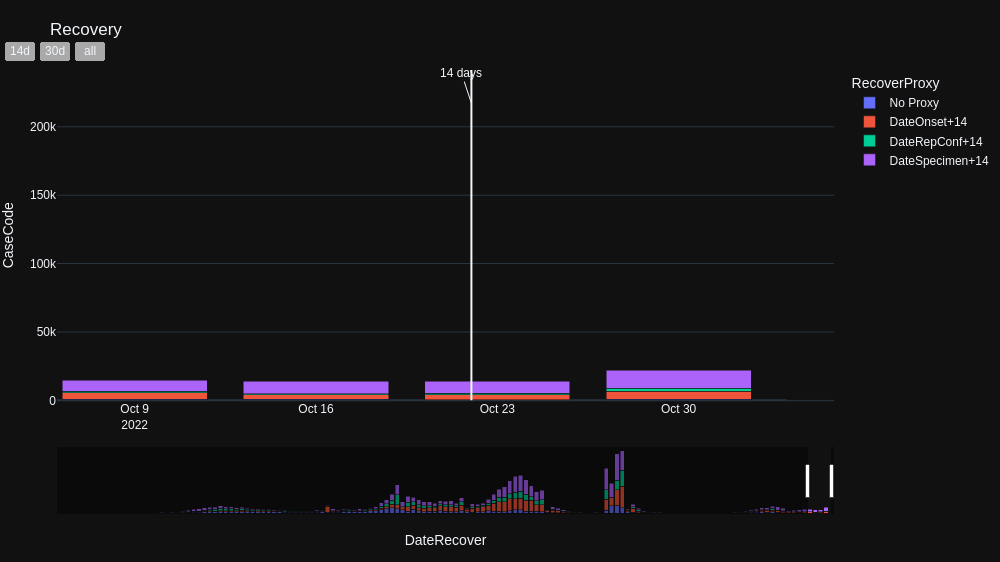
Daily recoveries by date proxies are shown in the chart below. Date proxies had
to be used in this tracker for recoveries with no date recovered entry.
Data within the last 15 days is not yet complete due to reporting delays and
the weekly recovery tagging by DOH.
Click here to see more on recovery statistics.
Deaths
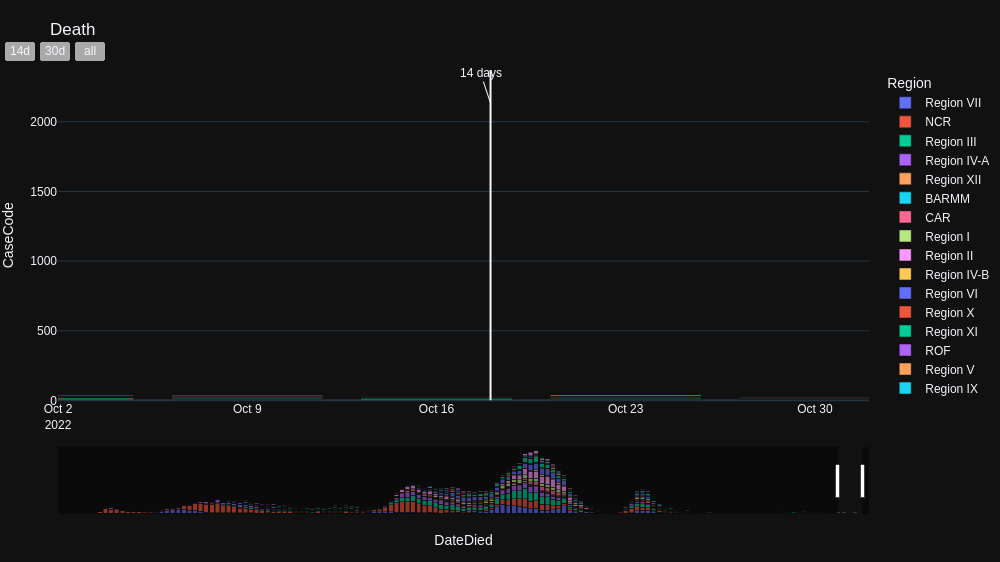
Daily deaths by region are shown in the chart below.
Click here to see more on death statistics.
Testing
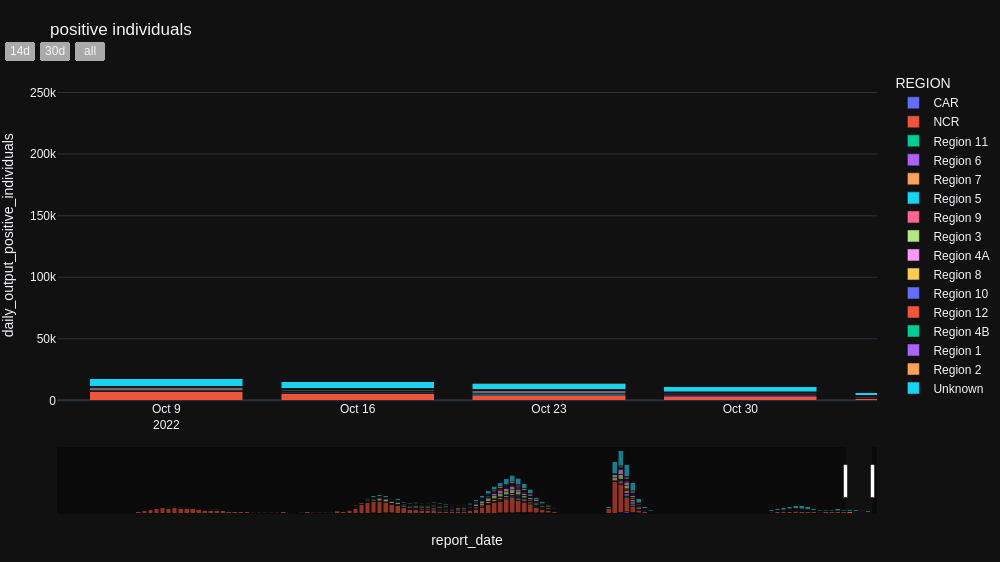
Daily test output by region is shown in the chart below.
Click here to see more on testing statistics.
Reporting
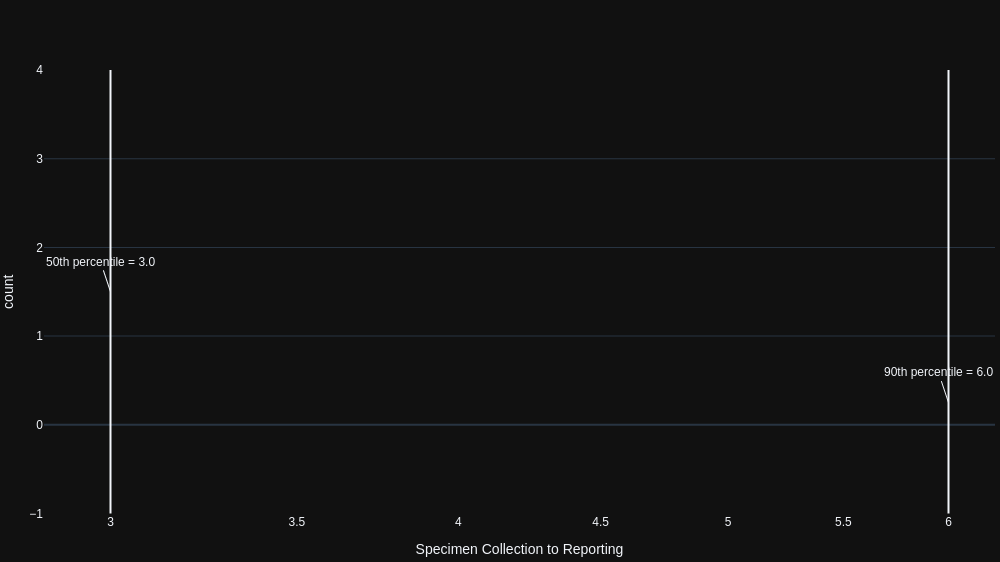
Distribution for the number of days it takes from specimen collection to
reporting is shown in the chart below.
Click here to see more on reporting statistics.
