Confirmed Cases - Last 14 Days

Links

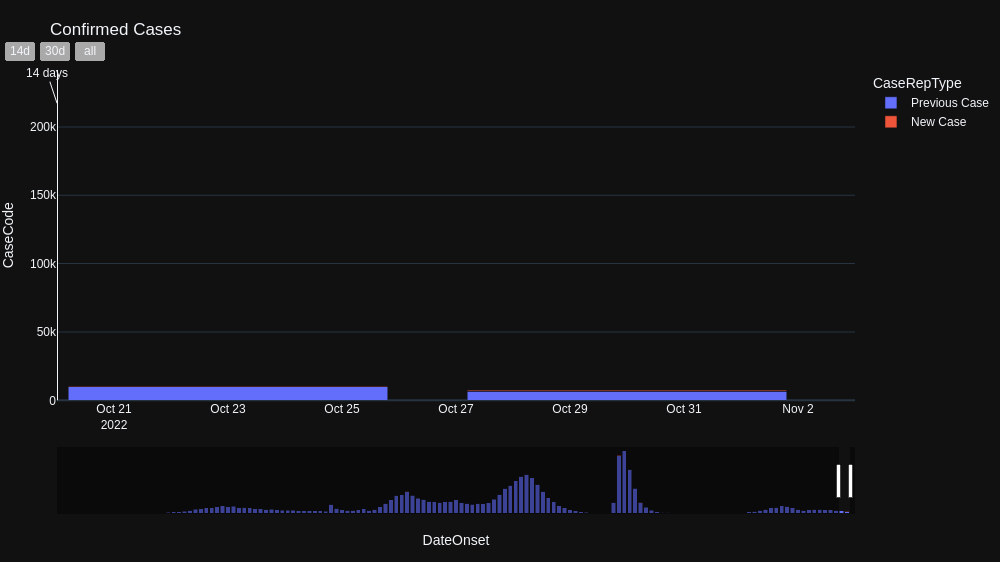
Confirmed Cases by Time of Reporting

Daily confirmed cases with highlighted newly reported cases are shown in the chart below.

Click on the image to open the interactive chart.

Date Proxy

Date proxies are shown in the chart below. Date of specimen collection is used by the DOH in their reporting for cases with no date of onset of illeness. The same is applied in this tracker. However, in the absence of both the date of onset of illness and date of specimen collection, the date of reporting is used.
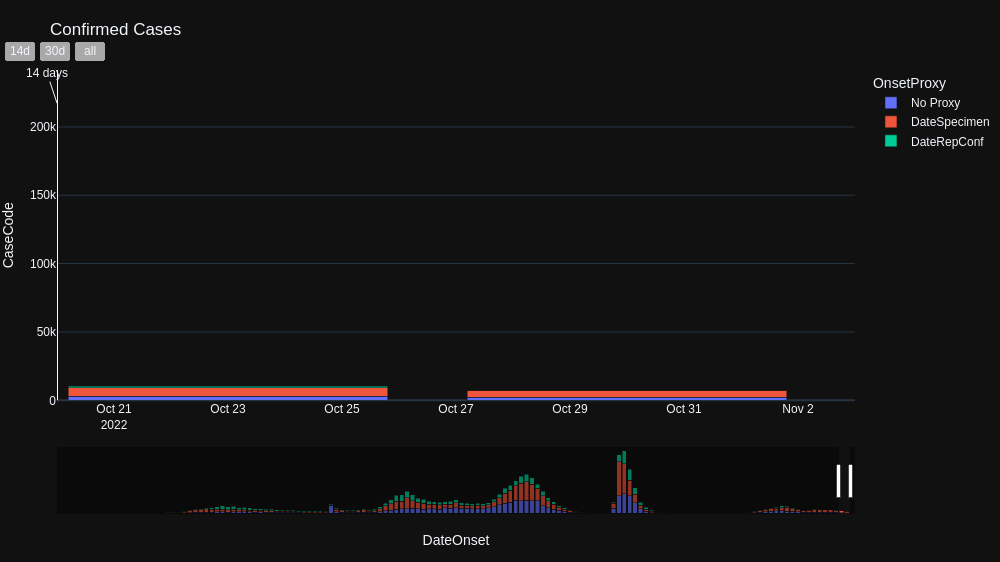
Click on the image to open the interactive chart.

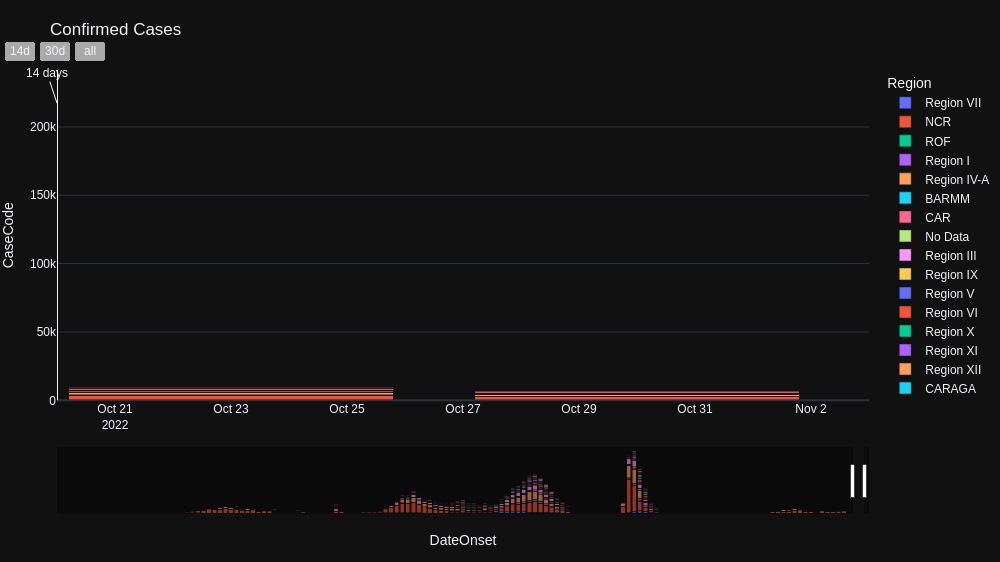
Daily Confirmed Cases by Region

Click on the image to open the interactive chart.

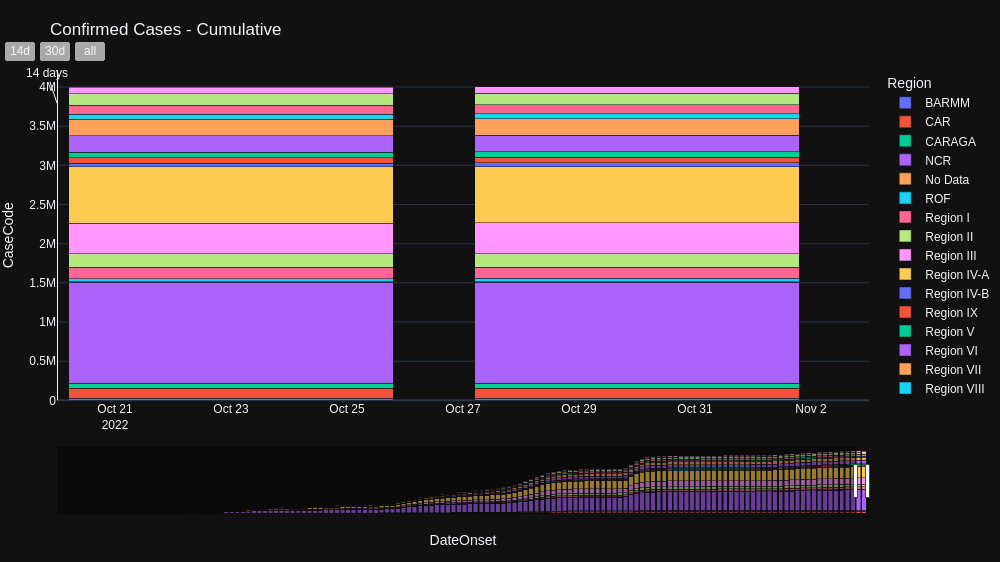
Cumulative Confirmed Cases by Region

Click on the image to open the interactive chart.

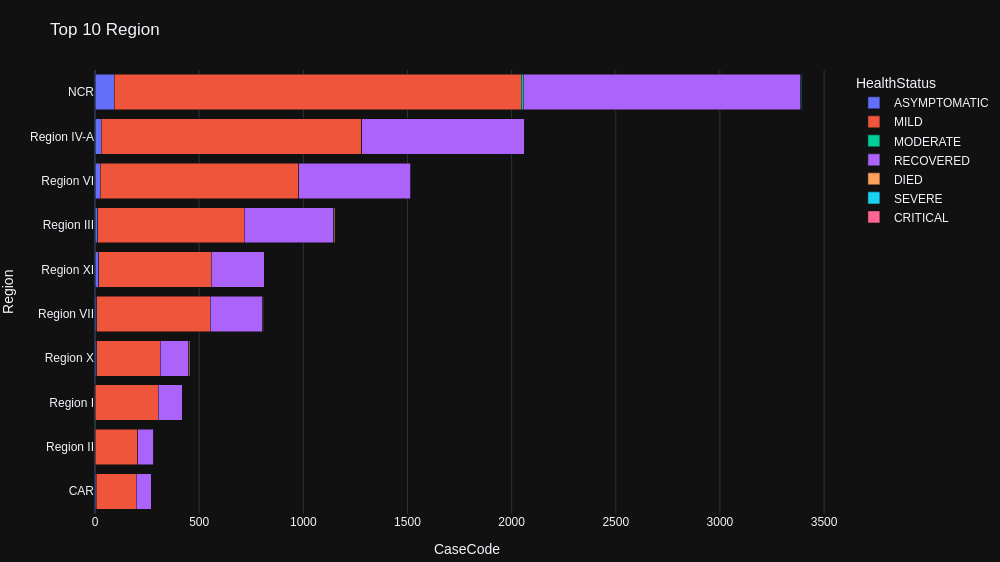
Top Region

Click on the image to open the interactive chart.

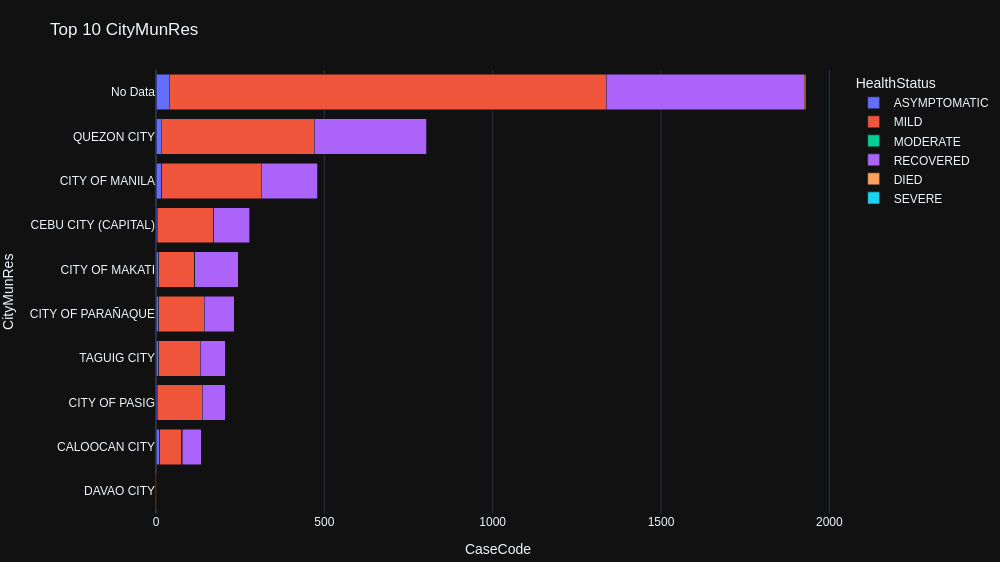
Top City/Municipality

Click on the image to open the interactive chart.

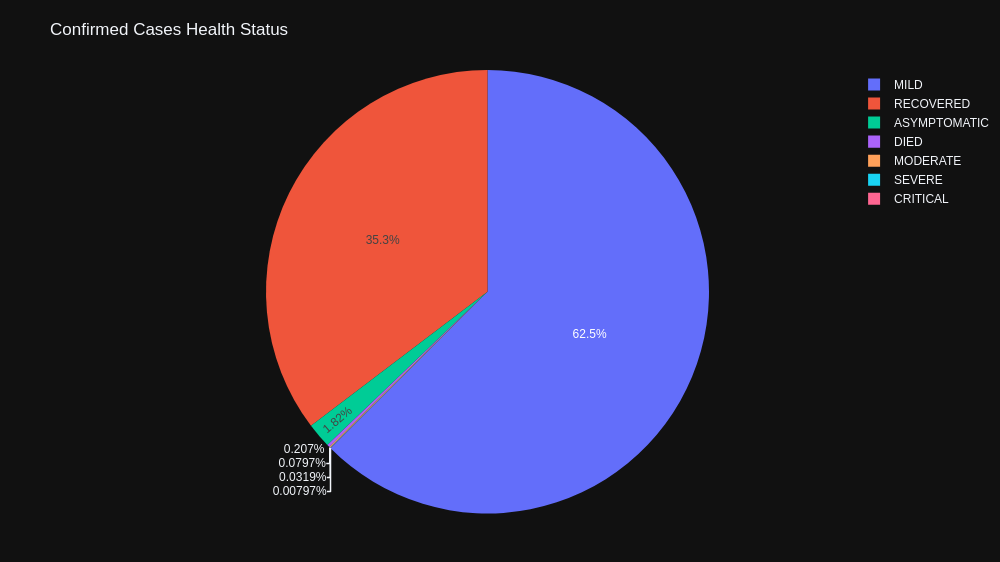
Health Status

Click on the image to open the interactive chart.

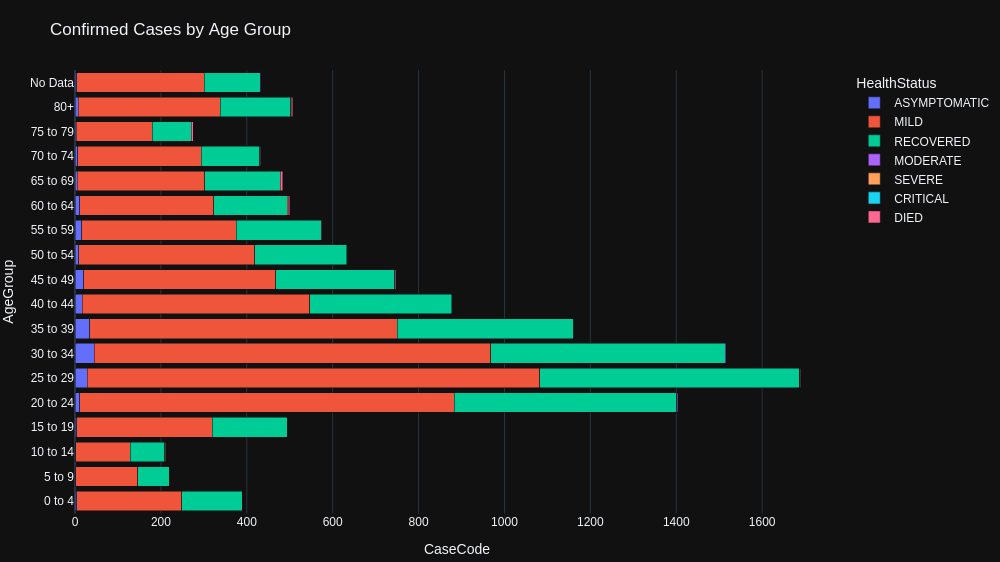
Age Group

Click on the image to open the interactive chart.